Getting Here
Located at the Head of the Great Australian Bight, Yalata Community is about 1,000km from Adelaide on the West Coast of South Australia, situated 200km northwest of Ceduna and south of the trans-Australian railway line, and east of Kalgoorlie in Western Australia.
This is truly remote Australia. There are domestic flights from Adelaide to Ceduna, but the only way to Yalata is by road. Travelling from overseas or interstate, a flight to Adelaide with connections to Ceduna and car rental is the best option, or take a scenic drive to us.

Requesting to enter Yalata – Closed community
Yalata Community is closed to the public, and entry only permitted via a Permit system.
All remote workers based in Yalata, essential services, maintenance contractors, Health Care Providers, Service Providers, and visitors are required to submit the Permit Application and should seek permission in advance, before planning to travel.
For more info, email permits@yalata.com.au.
Camping & Fishing
We have opened a designated areas of Our Lands to the public for recreational Camping and Fishing which is monitored through a strict Permit system.
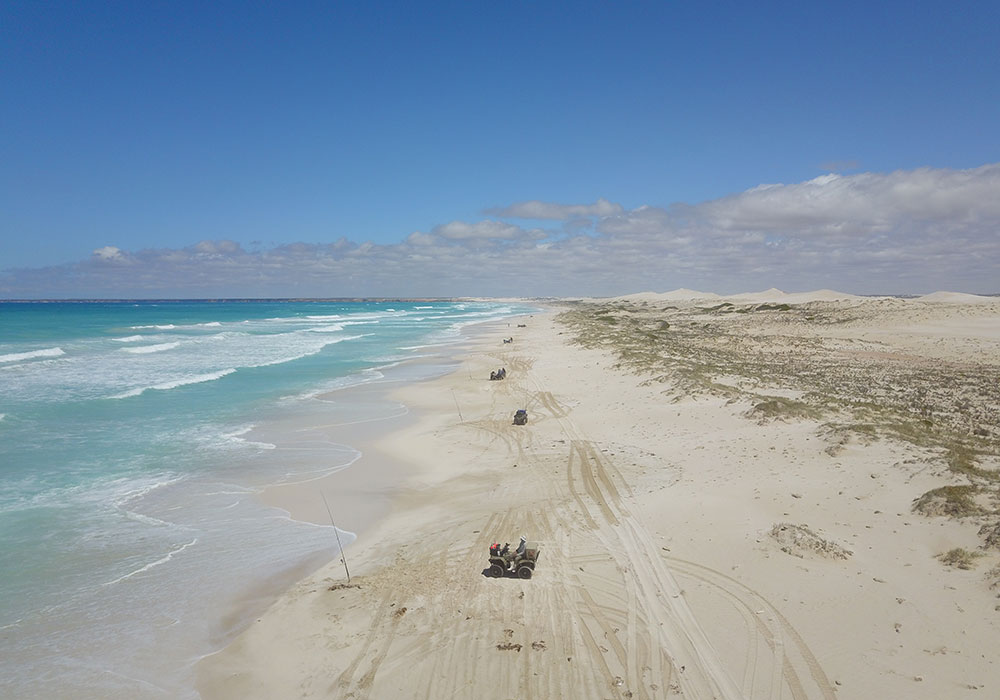
Guests can book one of 15 campsites, spread 55km along Yalata coastline, with campsites ranging from 100 to 900 metres off the beach with several marked entry points allowing vehicle/ATV access directly onto the beach.
Beach access roads are not marked on any map or accessible without a Permit, however can be provided upon request after campsite bookings has been made. See Camping and Fishing for more info.
Yalata weather
Yalata has a semi-arid climate with very little annual rainfall. The average annual temperature is 26° C and 130-250 mm of rain per year. It is dry for 288 days a year with an average humidity of 49% and an UV-index of 5.
Summer months are November to April with hot and dry conditions and temperatures often in excess of 40 degrees. Winter months are May to October often see clear days with temperatures in high teens to mid cold nights.
Average Annual temperatures and rainfall:
| Jan | Feb | Mar | Apr | May | Jun | Jul | Aug | Sep | Oct | Nov | Dec | |
|---|---|---|---|---|---|---|---|---|---|---|---|---|
| Mean Max (°C) | 27.9 | 27.7 | 26.7 | 25.0 | 21.4 | 18.8 | 18.4 | 19.8 | 22.6 | 24.7 | 26.0 | 27.1 |
| Mean Min (°C) | 16.0 | 16.1 | 14.3 | 11.8 | 8.9 | 6.3 | 5.2 | 6.0 | 8.0 | 10.4 | 12.5 | 14.5 |
| Mean Rain (mm) | 12.3 | 14.3 | 21.3 | 26.3 | 27.8 | 27.6 | 27.2 | 23.9 | 18.9 | 18.5 | 19.9 | 16.2 |
| Jan | Feb | Mar | Apr | May | Jun | Jul | Aug | Sep | Oct | Nov | Dec | |
|---|---|---|---|---|---|---|---|---|---|---|---|---|
| Daily Records Max (°C) | 48.5 | 47.6 | 45.3 | 42.2 | 36.5 | 32.0 | 31.2 | 33.0 | 38.6 | 45.0 | 46.6 | 49.9 |
| Daily Records Min (°C) | 3.5 | 7.0 | 5.0 | 2.0 | 0.5 | -2.9 | -2.2 | -4.0 | -0.7 | 1.0 | 2.0 | 2.3 |
| Mean Max (°C) | Mean Min (°C) | Mean Rain (mm) | |
| Jan | 27.9 | 16.0 | 12.3 |
| Feb | 27.7 | 16.1 | 14.3 |
| Mar | 26.7 | 14.3 | 21.3 |
| Apr | 25.0 | 11.8 | 26.3 |
| May | 21.4 | 8.9 | 27.8 |
| Jun | 18.8 | 6.3 | 27.6 |
| Jul | 18.4 | 5.2 | 27.2 |
| Aug | 19.8 | 6.0 | 23.9 |
| Sep | 22.6 | 8.0 | 18.9 |
| Oct | 24.7 | 10.4 | 18.5 |
| Nov | 26.0 | 12.5 | 19.9 |
| Dec | 27.1 | 14.5 | 16.2 |
| Daily Records Max (°C) | Daily Records Min (°C) | |
| Jan | 48.5 | 3.5 |
| Feb | 47.6 | 7.0 |
| Mar | 45.3 | 5.0 |
| Apr | 42.2 | 2.0 |
| May | 36.5 | 0.5 |
| Jun | 32.0 | -2.9 |
| Jul | 31.2 | -2.2 |
| Aug | 33.0 | -4.0 |
| Sep | 38.6 | -0.7 |
| Oct | 45.0 | 1.0 |
| Nov | 46.6 | 2.0 |
| Dec | 49.9 | 2.3 |


